
Industry
Automotive and Motorsport
Motorsport and automotive environments rely on preparation, reliability, measurement and performance under pressure. JBI brings the same thinking into business improvement, reporting and operational systems.
In Ricky's Words
Why I enjoy working in automotive and motorsport
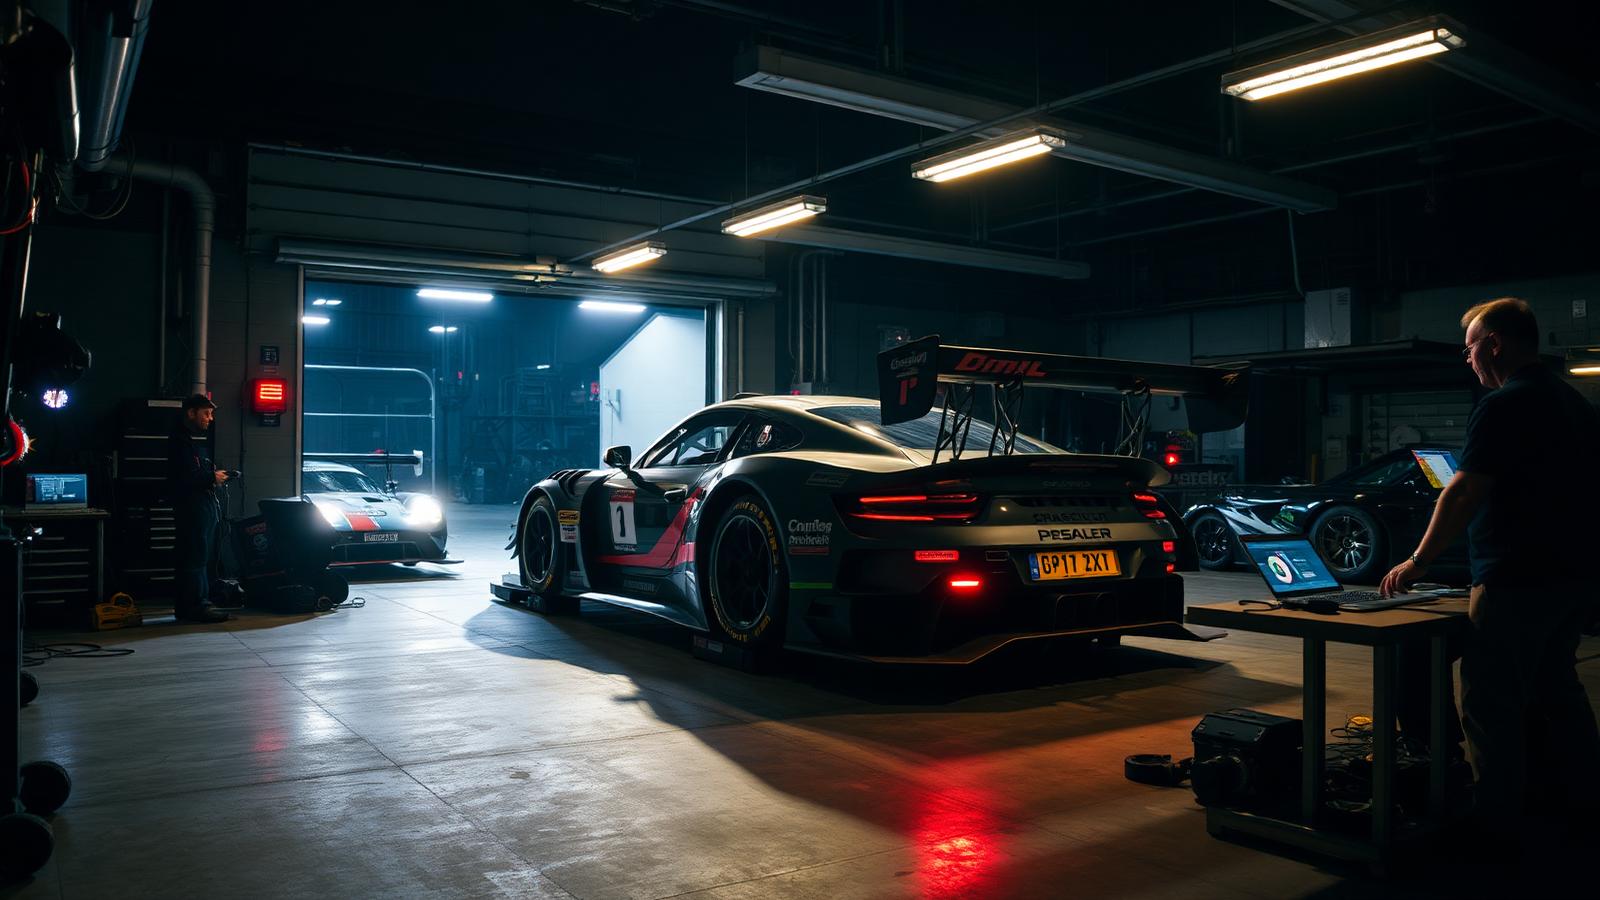
This one is personal. Johnstone Business Intelligence backs Australian Innovation Race Cars and I spend plenty of weekends trackside. Motorsport runs on the same principle as good business intelligence: prepare properly, measure what matters and do not kid yourself about the result. Workshops and race teams both live or die on preparation, parts and data, and that is a language I enjoy speaking.
Common Challenges
What we see most often
- Performance data spread across systems
- Manual reporting
- Maintenance tracking issues
- Inventory or parts visibility
- Team coordination challenges
- Lack of continuous improvement structure
Capability 01
Business Intelligence and Reporting
Whether it is a workshop or a race program, performance and cost run in parallel. Reporting brings job, part, hour and result data together so decisions are made between sessions, not after the season.
Examples
- Job and workshop performance: labour recovery, hours sold and rework
- Parts and consumable cost by vehicle, job or program
- Session and event performance against setup and component life
- Component life and replacement tracking against cost
- One program or workshop pack refreshed automatically
KPIs that matter
KPI reference for automotive and motorsport
The measures we most often build for this industry, why each one matters, how it is calculated and the bands we benchmark against.
| KPI | Why it matters | How to measure | World class | Benchmark | Typical |
|---|---|---|---|---|---|
| Labour recovery % | Are hours being sold? | Billable hours ÷ available hours. | ≥85% | 70–80% | 55–70% |
| Rework rate % | Are we doing it right first time? | Rework jobs ÷ total jobs. | ≤1% | 2–5% | 6%+ |
| Cost per job or event | Is spend controlled? | Total cost ÷ jobs or events completed. | Falling | Flat | Rising |
| Reliability finish rate % | Did the car complete the job? | Sessions completed ÷ sessions started. | ≥98% | 90–96% | <88% |
| Preparation on time % | Was it ready when needed? | Jobs ready by deadline ÷ jobs due. | ≥98% | 90–95% | <85% |
Capability 02
Data Engineering, Fabric and AI Readiness
Telemetry, job systems and finance are rarely joined. We build the model so cost and performance can be seen side by side.
Examples
- Join job management, parts, telemetry and finance data
- Standardise vehicle, component and job structures
- Automate component life and usage history
- Data quality checks on unallocated hours and parts
- History that supports setup and reliability analysis
Capability 03
Power Platform and Business Applications
Time in the shed is expensive. We digitise the checklists and logs so nothing is retyped later.
Examples
- Job card and time capture at the bay
- Build sheet, setup and change logging
- Component fitment and life tracking
- Parts request and stock capture
- Automated event readiness and checklist sign-off
Capability 04
Continuous Improvement and Business Process Improvement
Consistency wins events and keeps a workshop profitable. We standardise the process behind both.
Examples
- Map the job or event preparation cycle
- Standard work for repeatable build and service tasks
- Debrief routine that captures learning as an action
- Reduce rework and repeat faults with real data
- Improvement register measured in hours and reliability
What we work on here
- Performance data spread across systems
- Manual reporting
- Maintenance tracking issues
- Inventory or parts visibility
- Team coordination challenges
- Lack of continuous improvement structure
What changes for you
- Better performance visibility
- Better preparation
- Stronger team alignment
- Improved reliability
- Better decision-making under pressure